Surge protective devices (SPDs)are required to be tested under impulse discharge currents mainly with waveforms of 8/20 ms and 10/350 ms. However, with the improvement of SPD products, the performance and withstand capability of SPDs under such standard test currents need more investigation. In order to investigate and compare the withstand capability of SPDs under 8/20 ms and 10/350 ms impulse currents, experiments are carried out on three types of typical metal-oxide varistors (MOVs) that are used for class I SPDs. The results show that the MOVs with higher limiting voltage have better withstand capability under 8/20ms impulse current, while the conclusion under 10/350ms impulse current is opposite. Under 10/350 ms current, the MOV failure is related to the absorbed energy per unit volume under single impulse. Crack is the main damage form under 10/350ms current, which can be described as one side of the MOV plastic encapsulation and the electrode sheet peeling off. Ablation of the ZnO material, caused by the flashover between the electrode sheet and ZnO surface, appeared near the MOV electrode.
Surge protective devices (SPDs) connected to lowvoltage power systems, telecommunication and signal networks are required to be tested under requirements of IEC and IEEE standards [1-5]. Considering the location and possible lighting current it may suffer, such SPDs are required to be tested under impulse discharge currents mainly with waveforms of 8/20 ms and 10/350 ms [4-6]. The current waveform of 8/20 ms is commonly used to simulate the lightning impulse [6-8]. The nominal discharge current (In) and the maximum discharge current (Imax) of SPDs are both defined with the 8/20 ms impulse current [4-5]. Moreover, the 8/20 ms current impulse is widely used for SPD residual voltage and operating duty tests [4]. 10/350ms impulse current is usually used to simulate the direct lightning return stroke current [7-10]. This waveform meets the parameters for the impulse discharge current for class I SPD test, which is especially used for the additional duty test for class I SPDs [4]. During the type tests [4-5], specified number of impulse currents are required to apply on SPDs. For example, fifteen 8/20 ms currents and five 10/350 ms impulse currents are required for operating duty test for class I SPDs [4]. However, with the improvement of SPD products, the performance and withstand capability of SPDs under such standard test currents need more investigation. Previous researches usually concentrated on the MOV performance under multiple 8/20 ms impulse current [11-14], while the performance under repeated 10/350 ms impulse current have not been investigated thoroughly. Moreover, the class I SPDs, installed at the points of high exposure in buildings and distribution systems, are more vulnerable to lightning strokes [15-16]. Therefore, the performance and withstand capability of class I SPDs under 8/20 ms and 10/350 ms impulse currents are necessary to be investigated. This paper experimentally investigate the withstand capability of class I SPDs under 8/20 ms and 10/350 ms impulse currents. Three types of typical MOVs used for class I SPDs are adopted for analysis. The current amplitude and number of impulses are adjusted for several experiments. Comparison is carried out on the withstand capability of MOVs under the two kinds of impulse currents. The failure mode of the MOV samples that failed after tests are also analyzed.
Three types of typical MOVs used for class I SPDs are adopted in the experiments. For each type of MOVs, 12 samples made by EPCOS are adopted under four kinds of experiments. Their basic parameters are shown in TABLE I, where In represent the nominal discharge current of MOVs under 8/20µs impulse, Imax represent the maximum discharge current under 8/20µs impulse, Iimp represent the maximum discharge current under 10/350µs impulse, UDC1mA represent the MOV voltage measured under 1 mA DC current, Ur represent the MOV residual voltage under In.
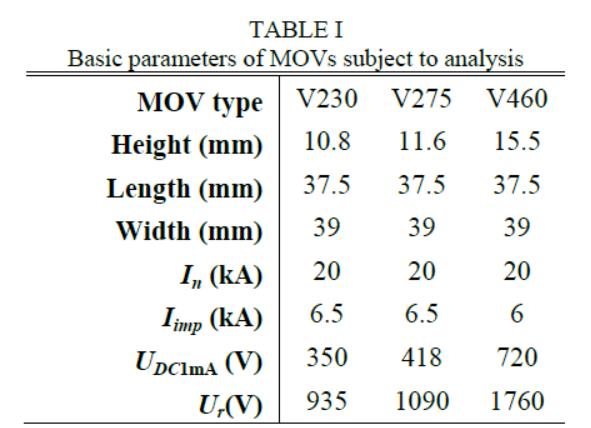
Fig. 1 shows the impulse current generator that can be adjusted to output 10/350 ms and 8/20 ms current impulses. The Pearson coil is adopted to measure the impulse currents on the tested MOVs. The voltage divider with ratio of 14.52 is used to measure the residual voltages. The digital oscilloscope of TEK DPO3014 is adopted to record the experimental waveforms.
According to the SPD test standard [4], the amplitudes adopted for 8/20 ms current include 30kA (0.75Imax) and 40kA (Imax). The amplitudes adopted for 10/350 ms current include 0.75Iimp and Iimp. Reference to the operating duty test for MOVs [4], fifteen 8/20ms impulses are applied on MOV samples, and the interval between impulses is 60 s. Therefore, the flowchart of the experimental procedure is shown in Fig. 2.
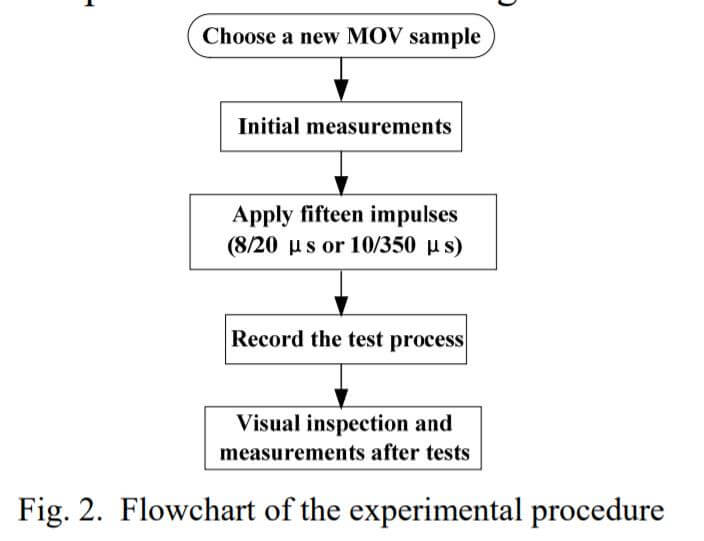
The experimental procedure can be described as:
(1) Initial measurements: The MOV samples are characterized with UDC1mA,Ur, and photographs at the beginning of experiments.
(2) Apply fifteen impulses: Adjust the impulse current generator to output the demanded impulse current. Fifteen impulses with interval of 60 s are applied on the MOV sample successively.
(3) Record the measured waveforms of the MOV currents and voltages after each impulse application.
(4) Visual inspection and measurements after the tests. Check the surface of the MOV for puncture or flashover. Measure the UDC1mA and the Ur after the tests. Take photographs of the damaged MOVs after tests. The pass criteria for the experiments, according to IEC 61643-11 [4], require that both the voltage and current records, together with a visual inspection, shall show no indication of puncture or flashover of the samples. In addition, the IEEE Std. C62.62 [5] suggested the posttest measured Ur (MOV residual voltages at In) shall not deviate more than 10% from the pretest measured Ur. The Std. IEC 60099-4 [17] also requires that the UDC1mA should not deviate more than 5% after the impulse tests.
- The withstand capability under 8/20 ms impulse current
In this section, the 8/20 ms impulse currents with amplitudes of 0.75Imax and Imax are applied on the SPD samples respectively. The change ratio for the posttest measured UDC1mA and the Ur is defined as:
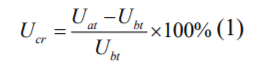
where, Ucr represents the change ratio of the measured values. Uat represents the value measured after the tests. Ubt represents the value measured before tests.
3.1 The results under 8/20 ms impulse current with peak of 0.75Imax
The test results for three types of MOVs under fifteen 8/20 ms impulse currents with peak of 0.75Imax (30 kA) are shown in TABLE II. The result for every type of MOV is the average of three same samples.
TABLE II
Results under 8/20 ms impulse currents with 30 kA peak
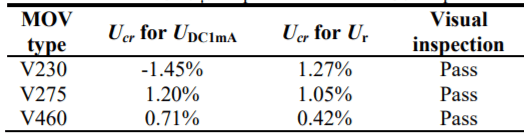
It can be seen from TABLEII that after fifteen 8/20 ms impulses have been applied on the MOVs, the changes of UDC1mA and Ur are minor. The “Pass” for visual inspection means no visible damage on the tested MOVs. Moreover, it can be observed that with the increase of the MOV limiting voltage, the Ucr becomes smaller. Such as the Ucr is the smallest for V460 type MOV. It can be concluded that the three types of MOVs could all pass the fifteen 8/20 ms impulse with 30 kA peak.
3.2 The results under 8/20 ms impulse current with peak of Imax
Considering the experimental results above, the amplitude of 8/20 ms current is increased to 40 kA (Imax). In addition, the number of impulses is increased to twenty for V460 type MOV. The experimental results are shown in TABLE III. In order to compare the energy absorption in the three type MOVs, Ea/V is used to represent the absorbed energy per unit volume for the average of fifteen or twenty impulses. Here, the “average” is considered because the energy absorption in MOVs are slightly different under each impulse.
TABLE III
Results under 8/20 ms impulse currents with 40 kA peak
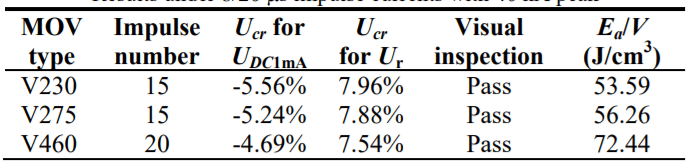
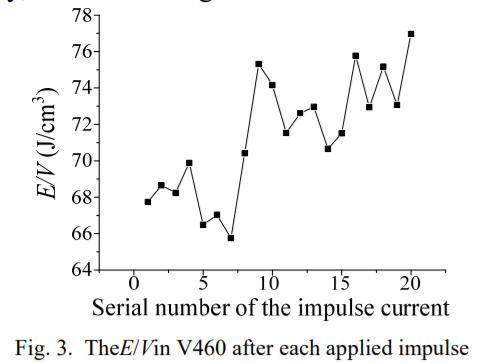
It can be observed from TABLE III that when the current amplitude is increased to 40 kA, the Ucr for UDC1mA deviate more than 5% for V230 and V275, though the change of MOV residual voltage is still within the effective range of 10%. The visual inspection also shows no visible damage on the tested MOVs. ForV230 and V275 type MOVs, the Ea/V means the absorbed energy per unit volume with average of fifteen impulses. The Ea/V for V460 represents the absorbed energy per unit volume with average of twenty impulses. TABLE III shows that the MOVs with higher limiting voltage (V460) have larger Ea/V than the MOVs with lower limiting voltage (V275 and V230). Moreover, with the impulse current repeatedly applied on the V460, the absorbed energy per unit volume (E/V) increases gradually, as shown in Fig. 3.
Therefore, it can be concluded that the V230 and V275 type MOVs could not withstand fifteen 8/20ms current impulses with peak of Imax, while the V460 type MOV could withstand the maximum discharge current up to 20 impulses. This means that the MOVs with higher limiting voltage have better withstand capability under 8/20ms impulse current.
4. The withstand capability under 10/350 ms impulse current
In this section, the 10/350 ms impulse currents with amplitudes of 0.75Iimp and Iimp are applied on the SPD samples respectively.
4.1 The results under 10/350 ms impulse current with peak of 0.75Iimp
Since the Iimp of the three types of MOVs are different, 10/350 ms currents with amplitude of 4875A are applied on V230 and V275, and impulses with amplitude of 4500 A are applied on V460. After applying fifteen impulse currents, the changes for UDC1mAand Ur on the tested MOVs are shown in TABLE IV. The ∑E/V means the summation of E/V for the applied impulses.
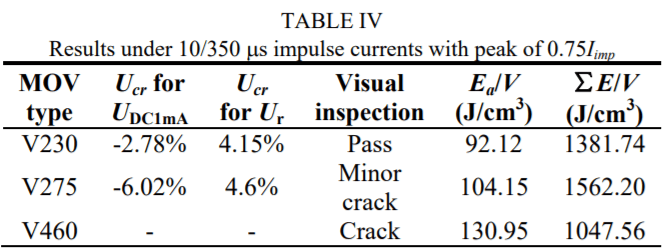
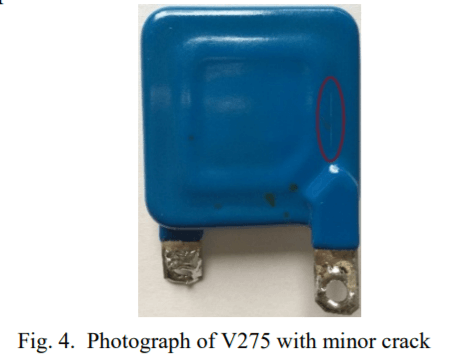
It can be seen from TABLE IV that after applying fifteen 10/350 ms currents with peak of 0.75Iimp, the V230 could pass the test, while the change for UDC1mA of V275 deviate more than 5%. Swelling and minor crack also appeared on the plastic encapsulation of V275. The photograph of V275 with minor crack is shown in Fig. 4.
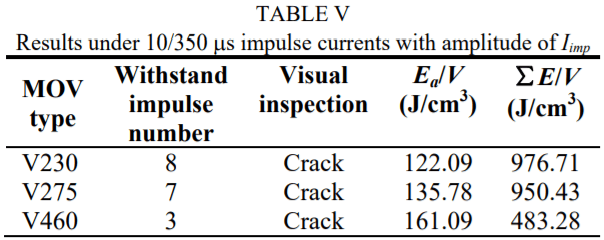
For V460 type MOV, after the eighth 10/350 ms impulse with peak of 4500A is applied, the MOV cracked and the measured voltage and current waveforms are abnormal. For comparison, the measured voltage and current waveforms under seventh and eighth 10/350 ms impulse on V460 are shown in Fig. 5.
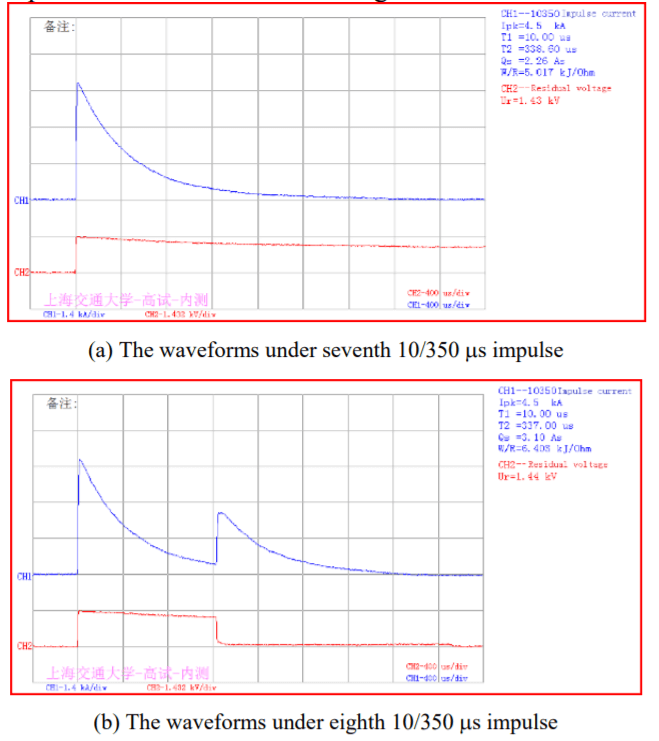
Fig. 5. The measured voltage and current waveforms on V460 under 10/350 ms impulse
For V230 and V275, ∑E/V is the summation of E/V for fifteen impulses. For V460,∑E/V is the summation of E/V for eight impulses. It can be observed that although the Ea/V of V460 is higher than that of V230 and V275, the total ∑E/Vof V460 is the lowest. However, the V460 experienced the most serious damage. This means that for the unit volume of MOV, the MOV failure under 10/350 ms current is not related to the total absorbed energy (∑ E/V), but may be more related to the absorbed energy under single impulse (Ea/V). It can be concluded that under 10/350 ms impulse current, the V230 could withstand more impulses than the V460 type MOVs. This means that the MOVs with lower limiting voltage have better withstand capability under 10/350 ms current, which is opposite from the conclusion under 8/20 ms impulse current.
4.2 The results under 10/350 ms impulse current with peak of Iimp
When the amplitude of 10/350 ms current is increased to Iimp, all the tested MOVs could not pass fifteen impulses. The results under 10/350 ms impulse currents with amplitude of Iimp are shown in TABLE V, where the “Withstand impulse number” means the impulse amount that the MOV could withstand before crack.
It can be observed from TABLE V that the V230 with Ea/V of 122.09 J/cm3 could withstand eight 10/350 ms impulses while the V460with Ea/V of 161.09 J/cm3 could only pass three impulses, though the peak current adopted for V230 (6500 A) is higher than that for V460 (6000 A). This validate the conclusion that the MOVs with high limiting voltage are more easily damaged under 10/350 ms current. This phenomenon can be explained as: the large energy carried by 10/350 ms current will be absorbed in MOVs. For MOVs with high limiting voltage under 10/350 ms current, much more energy will be absorbed in the unit volume of MOV than that in the MOVs with low limiting voltage, and the excessive energy absorption will lead to MOV failure. However, the failure mechanism under 8/20 ms current need more investigation.
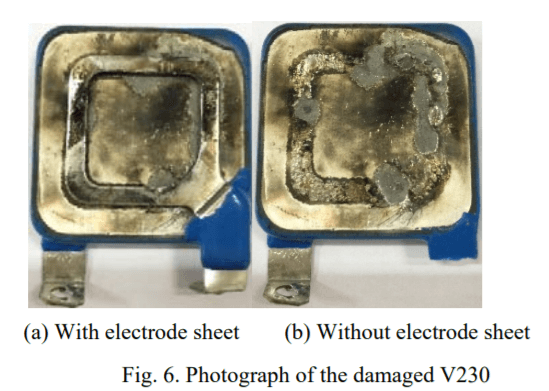
Visual inspection shows that same damage form is observed on the three types of MOVs under 10/350 ms current. One side of the MOV plastic encapsulation and the rectangular electrode sheet peel off. The ablation of ZnO material appeared near the electrode sheet, which is caused by the flashover between the MOV electrode and ZnO surface. The photograph of damaged V230 is shown in Fig. 6.
5. Conclusion
SPDs are required to be tested under impulse discharge currents mainly with waveforms of 8/20 ms and 10/350 ms. In order to investigate and compare the withstand capability of SPDs under 8/20 ms and 10/350 ms impulse currents, several experiments are carried out with maximum discharge current for 8/20 ms (Imax) and 10/350 ms (Iimp) waveform, as well as amplitudes of 0.75Imax and 0.75Iimp. Three types of typical MOVs used for class I SPDs are adopted for analysis. Some conclusions can be drawn.
(1) The MOVs with higher limiting voltage have better withstand capability under 8/20ms impulse current. The V230 and V275 type MOVs could not withstand fifteen 8/20ms impulses with peak of Imax, while the V460 type MOV could pass twenty impulses.
(2) The MOVs with lower limiting voltage have better withstand capability under 10/350 ms current. The V230 type MOV could withstand eight 10/350 ms impulses with peak of Iimp, while the V460 could only pass three impulses.
(3) Considering the unit volume of MOV under 10/350 ms current, the absorbed energy under single impulse may be related to MOV failure, instead of the summation of absorbed energy under all applied impulses.
(4) Same damage form is observed on three types of MOVs under 10/350 ms currents. One side of the MOV plastic encapsulation and the rectangular electrode sheet peel off. Ablation of the ZnO material, caused by flashover between the electrode sheet and ZnO surface, appeared near the MOV electrode.